
The HSE have released the annual health and safety figures for the year 2021/2022, and here are the 5 key takeaways.
1. Stress, depression or anxiety cases are at an all-time high
After work-related stress, depression or anxiety cases reached an all-time high of 824,000 in 2019/20, the number was slightly lower the following year. However, with 914,000 workers suffering from stress, depression or anxiety, this year’s numbers are 11% (91,000 cases) higher than last year’s – which is a record figure.
This means that cases have more than doubled from 442,000 in 2014/15, which is an increase of 107% in only seven years, which puts this worrying trend in perspective. This also correlates with a case rate increase from 1.4% workers to 2.8% in the same 7-year period.
What is the cause for this steep rise in cases? According to the HSE: “the effects of the coronavirus pandemic were found to be a major contributory factor to work-related stress, depression or anxiety”. This remains to be explored further if the trend continues in future statistics.
2. Illnesses and workplace injuries have gone up from last year
Total illnesses have increased by 130,000 cases (8%) from last year, which is the fourth consecutive year the number has increased; whilst workplace injuries have had an even larger jump from last year, increasing by 124,000 cases (28%).
As a noteworthy point: workplace injuries hit their lowest number ever last year (441,000) after an unexpected spike in 2019/20 of 691,000 incidents – the highest number since 2010; however, this year the figure has returned to trendline levels (565,000).
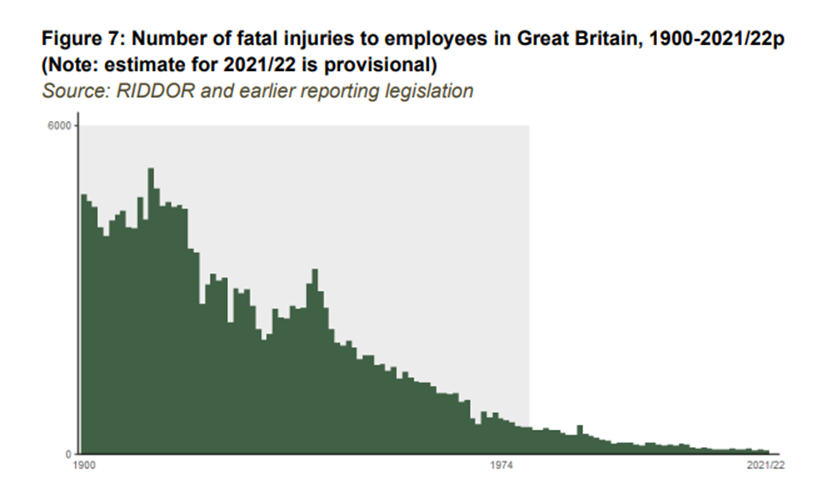
3. Workplace deaths continue to fall
After a spike in workplace fatal injuries last year (145), this year’s figure (123) is the second-lowest on record; and promisingly, the two lowest years on record for workplace fatalities have both occurred in the last three years.
This also means that the 5-year average of 134 deaths is the lowest 5-year average since RIDDOR began collecting records, which is yet more promising evidence of workplace deaths continuing to trend downwards.
Looking closer at the figures, the most common cause of fatal injuries continues to be falls from height (29), followed by being struck by a moving vehicle (23) and then being struck by a moving/flying/falling object (18), which altogether make up more than half (57%) of the fatalities.
The rest of these figures are broken down in more detail here: https://safesmart.co.uk/hse-releases-workplace-fatality-figures-for-2021-22/
4. Human health/social work has the highest illness rate among all industries
According to the Labour Force Survey (LFS), the average work-related illness rate per 100,000 workers for all industries is 4,190 (4.2%), and in contrast, human health/social work has a rate of 6.8%, which is the highest among all industries. This rate has actually lowered from 2020/21’s rate of 7.3% which resulted in 24% of all worker illnesses coming from the human health/social work sector alone.
This provides a clearer picture of how much the coronavirus pandemic affected the health of frontline healthcare workers during its peak.
5. Infectious disease rates are slightly down from last year
Prior to the coronavirus pandemic, overall workplace injuries were trending downwards; and they have now returned to a rate below pre-coronavirus levels. However, in contrast, the rate of illness caused or made worse by work is significantly above pre-coronavirus levels – 4.2% compared to 3.2% in both 17/18 and 18/19.
When looking closer at these figures, the rates of infectious disease (virus, bacteria) have almost tripled – 82,000 workers were affected in 2021/22 compared to 30,000 in 18/19. However, this latest figure is still lower than the 93,000 cases in 20/21, which was at the height of the coronavirus pandemic.
When compiled alongside the massive rise in stress, depression or anxiety cases, this year’s illness figures are the highest on record for both prevalence (1,8 million) and rate per workers (5.4%). With the rate and prevalence of illness also both increasing for the fourth year in a row, this is a growing area of concern and worry in occupational health & safety.
Bibliography
HSE (2022) ‘Health and safety statistics’. Available at: http://www.hse.gov.uk/statistics/ (accessed: 06/02/2023)
HSE (2022) ‘Workplace fatal injuries in Great Britain, 2022’. Available at: http://www.hse.gov.uk/statistics/pdf/fatalinjuries.pdf (accessed: 06/02/2023)
HSE (2022) ‘Kinds of accident statistics in Great Britain, 2022’. Available at: http://www.hse.gov.uk/statistics/causinj/kinds-of-accident.pdf (accessed: 06/02/2023)
HSE (2022) ‘Historical picture statistics in Great Britain, 2022 – trends in work-related ill health and workplace injury’. Available at: https://www.hse.gov.uk/statistics/history/historical-picture.pdf (accessed: 06/02/2023)
HSE (2023) ‘Industries’. Available at: https://www.hse.gov.uk/statistics/industry/ (accessed: 24/01/2023)
HSE (2022) ‘LFS – Labour Force Survey – Self-reported work-related ill health and workplace injuries: Index of LFS tables’. Available at: http://www.hse.gov.uk/statistics/lfs/index.htm#illness (accessed: 06/01/2023)
HSE (2022) ‘Index of data tables’. https://www.hse.gov.uk/statistics/tables/index.htm#riddor (accessed 06/02/2023)