The HSE have released the annual health and safety figures for the year 2023/2024, and here are the 5 key takeaways.
1. Musculoskeletal disorders have increased
Since last year, musculoskeletal disorders have gone up by 14%, which is 67,000 cases more than last year – the largest single year increase in 10 years. After hitting its lowest rate on record last year, almost 2 in every 100 workers has suffered from a musculoskeletal disorder this year. This is the highest rate since 2015/2016.
Illnesses mainly affecting the back (18%), illnesses mainly affecting the lower limbs (33%), and breathing or lung problems (30%) have also increased significantly.
2. Stress, depression or anxiety cases are down
After a record amount of cases in 2021/22 (914,000), and a similarly high 910,000 cases last year, this year has seen 134,000 (14%) fewer stress, depression or anxiety cases than last year. This has produced the lowest rate per 100,000 workers (2.3%) since 2018/19.
However, stress, depression or anxiety cases now make up more than half (55%) of all work-related illness cases – their largest proportion on record. These cases affect an estimated 2.3% of all workers, which is significantly higher than 20 years ago, where the rate was an estimated 1.6% of all workers.
3. Illnesses have fallen for the first time in 5 years
Total illnesses have fallen by 141,000 cases (8%) from last year – the first year-by-year decrease since 2018/19 after going up for 4 straight years.
This is mainly due to the large fall in stress, depression or anxiety cases, as well as 51,000 (48%) fewer infectious disease cases this year when compared to last year. ‘Other’ types of illnesses have also fallen by 48,000 cases (25%), contributing to the overall decrease.
4. Workplace injuries have increased
On the other hand, workplace injuries have gone up for the fourth straight year, rising by 28,000 cases (5%) since last year. Overall however, the injury rate per 100,000 workers remains on the downward trend, with a 3.5% rate 20 years ago, a 2.1% rate 10 years ago, and a 1.9% rate this year:
| Year | Rate per 100,000 workers |
|---|---|
| 2003/04 | 3,480 |
| 2013/14 | 2,130 |
| 2023/24 | 1,890 |
5. A third of workplace deaths were aged 60+
This year, a third (45) of workers killed in work-related accidents were aged 60 and over, even though only around 11% of workers in the UK are aged 60 and over. This is also up significantly from 25% last year and 24% the year before – a worrying development.
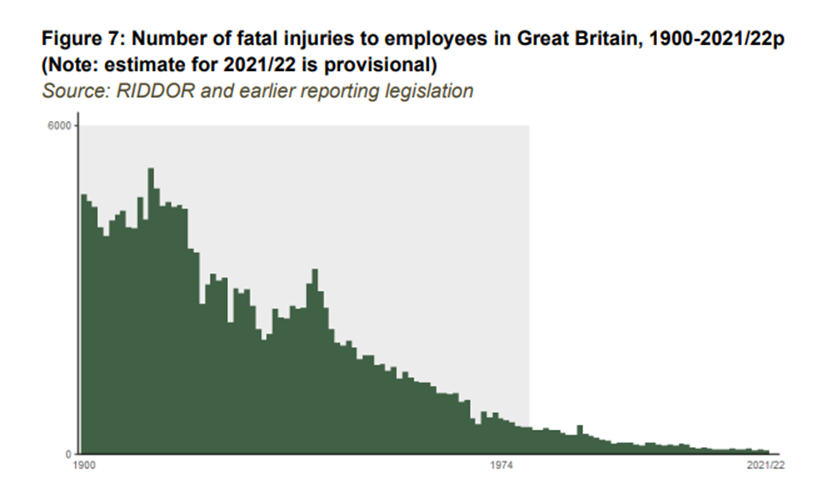
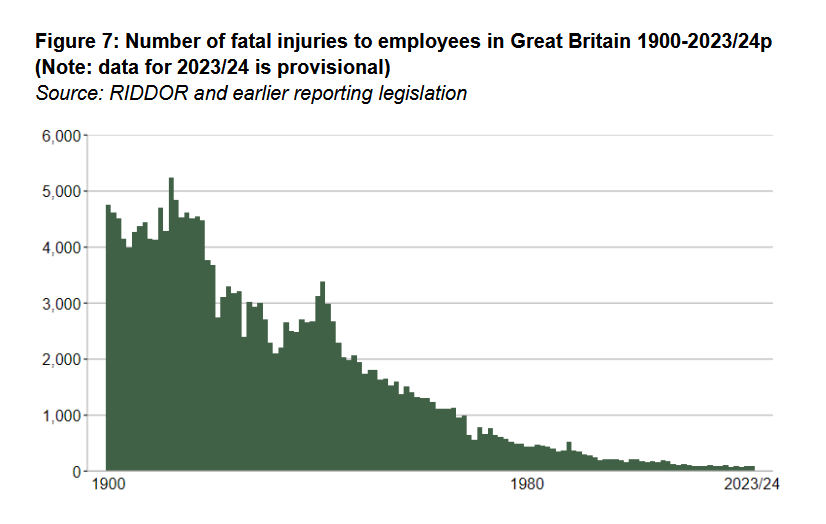
Overall, worker deaths (138) are similar to last year (136) with an almost identical rate per 100,000 workers (0.42%). Promisingly however, work-related deaths continue to trend downwards. The latest 5-year average of 131 deaths is the lowest since RIDDOR began collecting records in 1974, with three of the five lowest annual numbers on record occurring during this period.
The most common cause of fatal injuries to workers continues to be falls from height (50), which make up more than a third of all fatalities (36%). This is followed by being struck by a moving vehicle (25), struck by a moving/flying/falling object (20), and then being trapped by something collapsing/overturning (15).
Other recent trends continue, with construction remaining the industry with the most work-related fatalities (51), followed by agriculture, forestry and fishing (23), and manufacturing (16).
Bibliography
HSE (2024) ‘Health and safety statistics’. Available at: http://www.hse.gov.uk/statistics/ (accessed: 16/12/2024)
HSE (2024) ‘Work-related fatal injuries in Great Britain’. Available at: https://www.hse.gov.uk/statistics/fatals.htm (accessed: 16/12/2024)
HSE (2024) ‘Index of data tables’. Available at: https://www.hse.gov.uk/statistics/tables/index.htm (accessed: 16/12/2024)
ONS (2023) ‘The occupations most dependent on older and younger workers’. Available at: https://www.ons.gov.uk/employmentandlabourmarket/peopleinwork/employmentandemployeetypes/articles/theoccupationsmostdependentonolderandyoungerworkers/2023-05-31 (accessed: 16/12/2024)