
The Health and Safety Executive (HSE) has published its latest annual health and safety statistics for 2024/25. Below are five key takeaways from the data.
1. Work-related ill health reaches record high
An estimated 1.9 million workers suffered from work-related ill health (new or long-standing) in 2024/25, an increase from 1.7 million last year and the highest on record. The rate of worker illness remains stubbornly high, with the latest mark being the second-highest on record and significantly higher than pre-COVID levels.
Ill health also continues to be the dominant cause of harm at work, resulting in 35.7 million working days lost, compared to 4.4 million days lost due to non-fatal injuries.
2. Stress, depression or anxiety cases also reach a record high
Work-related stress, depression or anxiety accounted for 52% of all work-related ill health, affecting an estimated 964,000 workers in 2024/25 – an increase of 180,000 cases from last year. After falling by 127,000 cases last year, this latest figure is a record number – a very worrying trend.
Rates remain significantly higher than pre-pandemic levels, particularly in sectors such as public administration and defence, education, and health and social work.
This has led to 22.1 million working days lost, making mental health the single largest contributor to work-related absence.
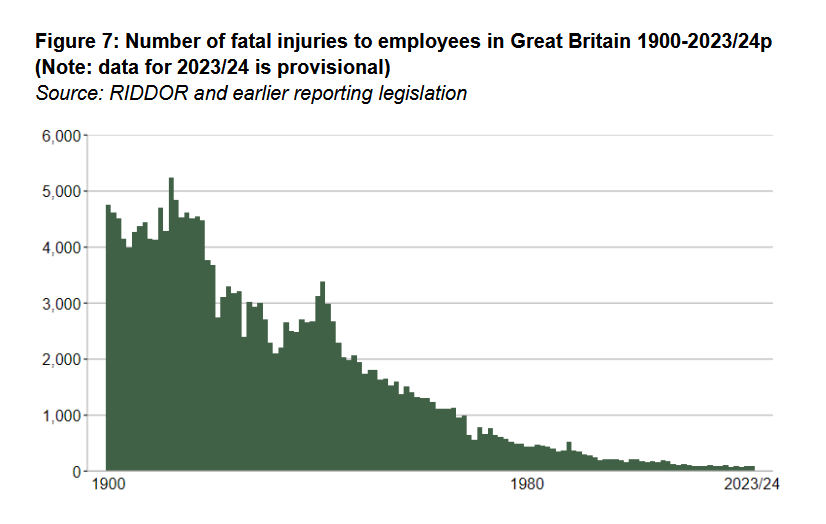
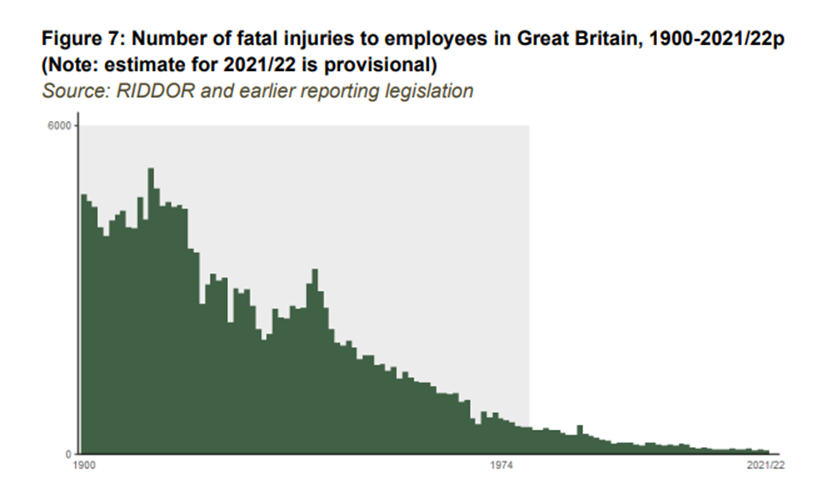
3. Workplace fatalities reach the lowest rate on record
In 2024/25, there were 124 worker fatalities, which is 14 fewer than last year and notably below the five-year average of 133. The overall worker fatality rate is also the lowest it has ever been.
However, an estimated 13,000 deaths each year are linked to past exposures at work, primarily from occupational lung diseases. Around 11,000 of these deaths are due to lung disease, including mesothelioma and work-related lung cancer.
4. Workplace injuries reach a 6-year high
According to the Labour Force Survey, an estimated 680,000 workers sustained a workplace non-fatal injury – significantly higher than both last year (613,000) and the five-year average (579,000). The rate of injury has also jumped slightly, reaching its highest mark in 6 years.
On the other hand, 59,219 employee injuries were reported by employers under RIDDOR, which is both the second-lowest number on record and the second-lowest rate of injury ever reported.
The most common causes of reported non-fatal injuries were:
- Slips, trips or falls on the same level (30%)
- Handling, lifting or carrying (17%)
- Being struck by a moving object (10%)
- Acts of violence (10%)
- Falls from height (8%)
5. Musculoskeletal disorders are trending upwards
Musculoskeletal disorders (MSDs) affected an estimated 511,000 workers in 2024/25, representing 27% of all work-related ill health cases. This is positively a drop from last year (547,000), but higher than the five-year average of 501,000 – which shows a trend upwards. MSDs remain a persistent and costly issue particularly in construction, transportation and storage, and administrative and support services.
MSDs also resulted in 7.1 million working days lost, with the most commonly affected areas being:
- The back (43%)
- Upper limbs or neck (41%)
- Lower limbs (15%)
Bibliography
HSE (2025) ‘Health and safety at work: Summary statistics for Great Britain 2025’. Available at: http://www.hse.gov.uk/statistics/ (accessed: 21/01/2026)
HSE (2025) ‘Work-related fatal injuries in Great Britain’. Available at: https://www.hse.gov.uk/statistics/fatals.htm (accessed: 21/01/2026)
HSE (2025) ‘Index of data tables’. Available at: https://www.hse.gov.uk/statistics/tables/index.htm (accessed: 21/01/2026)