We are proud to be a Schools North East Commercial Supporter – a self-funded school network which represents all 1,150 schools in the north-east region.
Formed by a group of headteachers in 2007, Schools North East provides networking, consultations, events and more for over 3,500 school officials in the north-east every year; and we are very pleased to be adding our support going forward.
The HSE have released the annual health and safety figures for the year 2023/2024, and here are the 5 key takeaways.
1. Musculoskeletal disorders have increased
Since last year, musculoskeletal disorders have gone up by 14%, which is 67,000 cases more than last year – the largest single year increase in 10 years. After hitting its lowest rate on record last year, almost 2 in every 100 workers has suffered from a musculoskeletal disorder this year. This is the highest rate since 2015/2016.
Illnesses mainly affecting the back (18%), illnesses mainly affecting the lower limbs (33%), and breathing or lung problems (30%) have also increased significantly.
2. Stress, depression or anxiety cases are down
After a record amount of cases in 2021/22 (914,000), and a similarly high 910,000 cases last year, this year has seen 134,000 (14%) fewer stress, depression or anxiety cases than last year. This has produced the lowest rate per 100,000 workers (2.3%) since 2018/19.
However, stress, depression or anxiety cases now make up more than half (55%) of all work-related illness cases – their largest proportion on record. These cases affect an estimated 2.3% of all workers, which is significantly higher than 20 years ago, where the rate was an estimated 1.6% of all workers.
3. Illnesses have fallen for the first time in 5 years
Total illnesses have fallen by 141,000 cases (8%) from last year – the first year-by-year decrease since 2018/19 after going up for 4 straight years.
This is mainly due to the large fall in stress, depression or anxiety cases, as well as 51,000 (48%) fewer infectious disease cases this year when compared to last year. ‘Other’ types of illnesses have also fallen by 48,000 cases (25%), contributing to the overall decrease.
4. Workplace injuries have increased
On the other hand, workplace injuries have gone up for the fourth straight year, rising by 28,000 cases (5%) since last year. Overall however, the injury rate per 100,000 workers remains on the downward trend, with a 3.5% rate 20 years ago, a 2.1% rate 10 years ago, and a 1.9% rate this year:
Year
Rate per 100,000 workers
2003/04
3,480
2013/14
2,130
2023/24
1,890
5. A third of workplace deaths were aged 60+
This year, a third (45) of workers killed in work-related accidents were aged 60 and over, even though only around 11% of workers in the UK are aged 60 and over. This is also up significantly from 25% last year and 24% the year before – a worrying development.
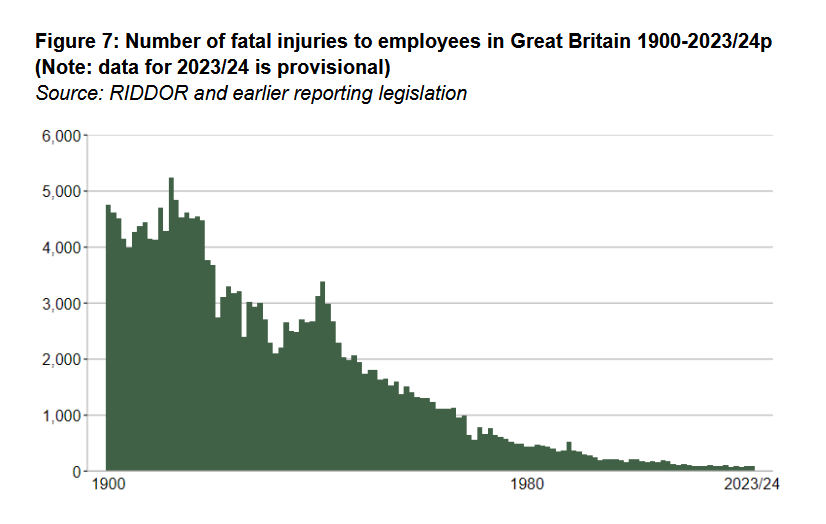
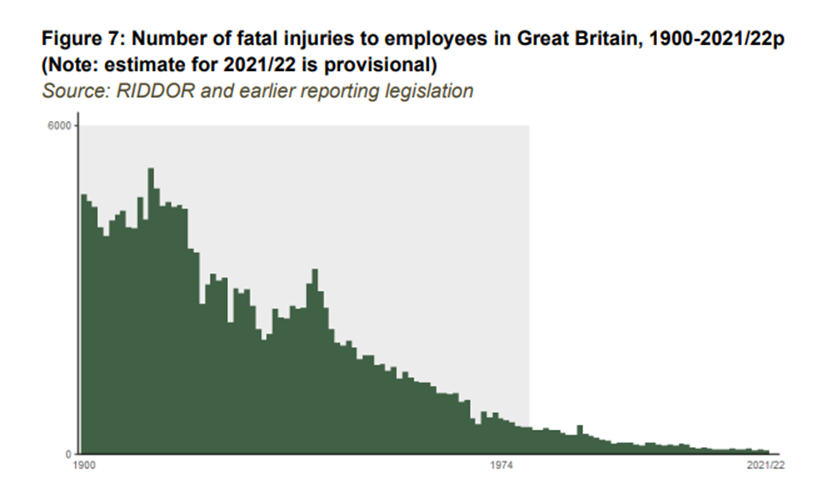
Overall, worker deaths (138) are similar to last year (136) with an almost identical rate per 100,000 workers (0.42%). Promisingly however, work-related deaths continue to trend downwards. The latest 5-year average of 131 deaths is the lowest since RIDDOR began collecting records in 1974, with three of the five lowest annual numbers on record occurring during this period.
The most common cause of fatal injuries to workers continues to be falls from height (50), which make up more than a third of all fatalities (36%). This is followed by being struck by a moving vehicle (25), struck by a moving/flying/falling object (20), and then being trapped by something collapsing/overturning (15).
Other recent trends continue, with construction remaining the industry with the most work-related fatalities (51), followed by agriculture, forestry and fishing (23), and manufacturing (16).
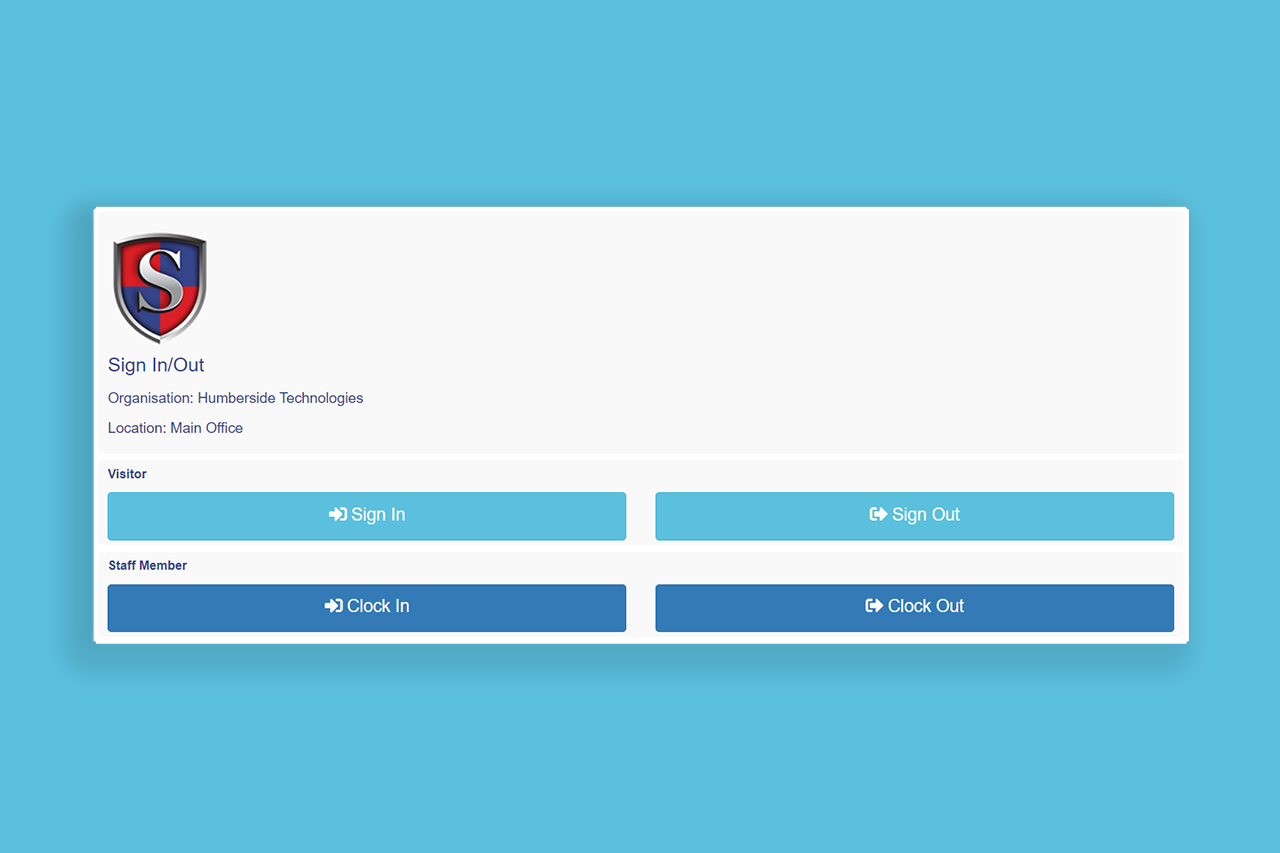
We are pleased to announce the release of a new staff sign-in and visitor management facility ‘Onsite Register‘ in Smartlog®.
Signing in visitors and staff into your premises can now be done through Smartlog. By using a simple sign-in display or placing QR codes in different areas, visitors and staff can effortlessly clock in and out of any setting or area of your premises.
You also have the ability to access the complete premises visiting history, or when conducting an investigation, you can see who was clocked into an area at a specific time.
The new module features the following:
Employee Sign-in
Easily and quickly sign in/out both visitors and employees, and keep a digital time-stamped track of everybody within your building premises for both safety and security purposes.
In real-time, accurately account for everybody in the event of an emergency evacuation, and conduct your Smartlog Fire Register with an up-to-date visitor list.
Scan a QR code
Signing in and out can also be contactless, with the ability to use a generated QR code. Simply print and display the QR code in your reception area, and visitors can scan in and out using their personal smartphones.
Individual registers for your different buildings, departments, or rooms can also be set up — each with their own unique QR code.
Employees can also sign in and out using the Smartlog App.
Receive Visitor Notifications
When a visitor signs in, an instant email notification is immediately sent to the person they are visiting to let them know that their guest has arrived.
Access Visitor History
You have instant access to the complete visiting history of visitors or staff members in any selected time period, including multiple visits. This is especially useful when you are carrying out an audit or investigation and would like to know who was on-site at a specific time.
This module is completely free to all our customers who use the full version of Smartlog. and is immediately available for Company Admins to use.
To book a demo of Onsite Register for your organisation or to request more information about Smartlog, visit our contact page or send us your query to info@safesmart.co.uk
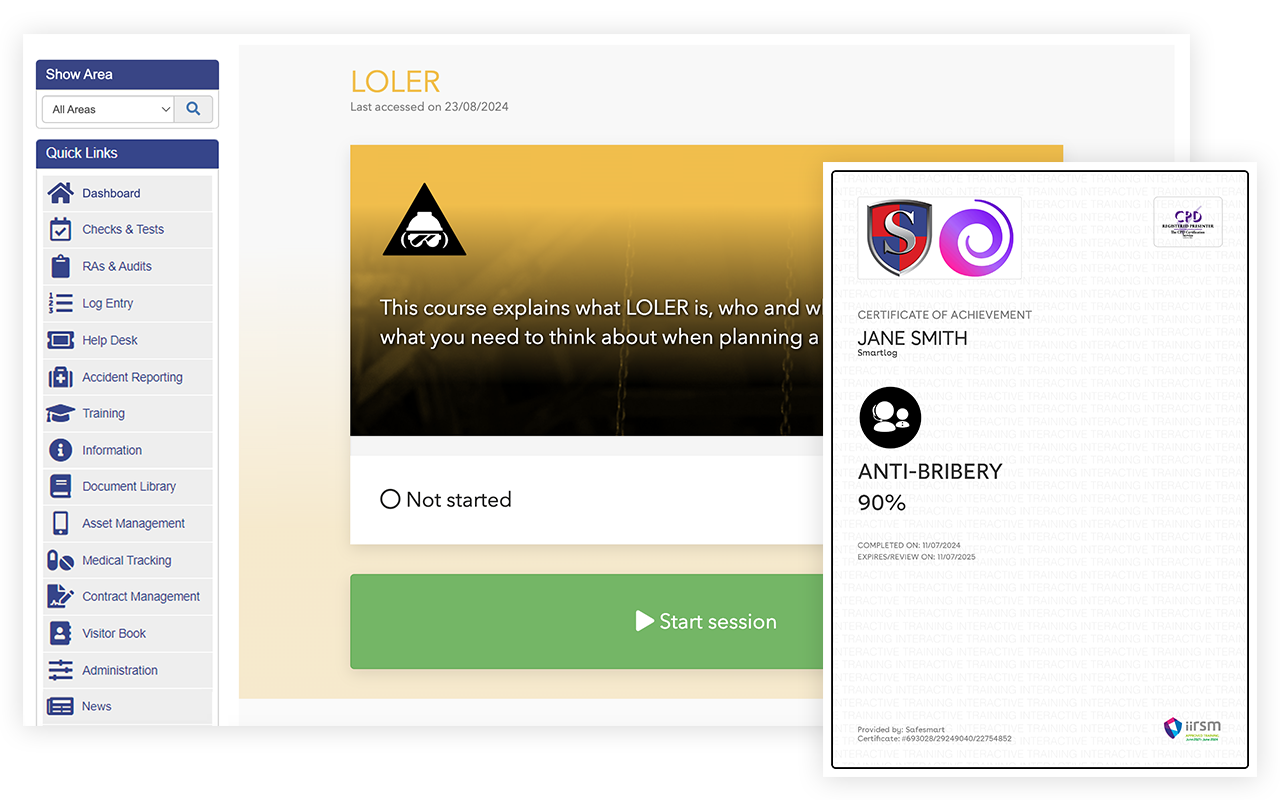
We are delighted to announce that we have partnered with eLearning specialists iHasco, and their extensive library of 200+ training courses are now available to purchase, assign and complete within Smartlog®.
Alongside Smartlog’s training course library and our recently released Training Course Creator, this new partnership with iHasco provides our clients with even more options for employee mandatory training.
Over 200 training courses
With video presenters, different language options and numerous interactive features, iHasco’s eLearning offers 200+ courses across the following main subjects:
From assigning training to tracking learners’ progress, all courses and credits can be managed within Smartlog. System alerts and email reminders are sent out exactly the same as regular Smartlog eLearning.
Additionally, all applicable course certifications and accreditations will be printed on users’ pass certificates, including:
CPD accreditation
Skills for Care
RoSPA
IIRSM approval
Wish to purchase course credits?
If you want to learn more about our new partnership, or wish to purchase course credits for your organisation, please contact your Smartlog Account Manager or email us on: info@safesmart.co.uk
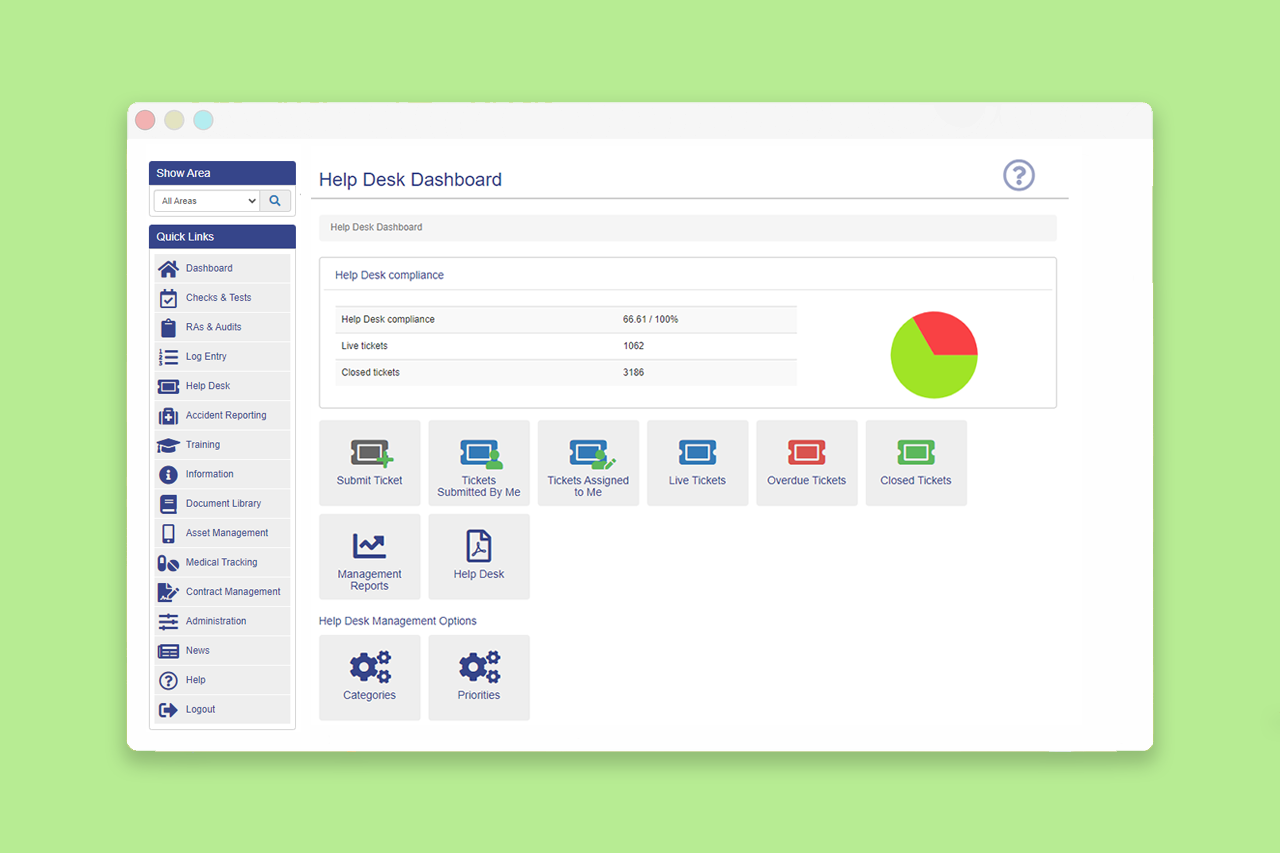
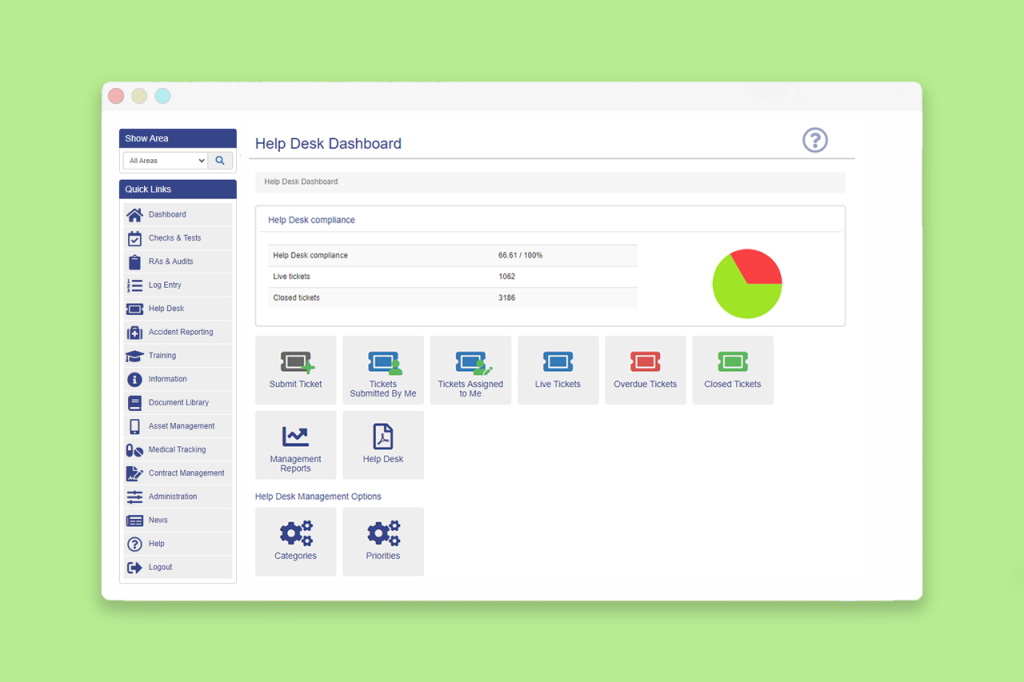
We are pleased to announce the release of a new Help Desk facility in Smartlog®.
The new help desk module allows your users to raise tickets regarding any premises issues in your organisation. Live tickets can be tracked, updated and then resolved within Smartlog and through immediate email notifications – including all related costs and time spent fixing the issue.
Help Desk provides you with the following abilities:
Create custom ticket categories Any user can raise a ticket, and custom categories can be created. All created tickets are automatically categorised and can be immediately assigned to the responsible user to resolve.
Set time-bound priority levels You can set custom priority levels for your tickets, determining exactly the length of time the ticket requires to be resolved. This enables your SLAs with your contractors to be automatically built-in, for example.
Keep a track of all costs You can input and track all costs related to a ticket, and you can also track the exact time spent resolving the ticket. Also, anyone working on the ticket can update it anytime with their detailed costs.
Live email updates From the raising of a ticket, during its resolution, and to its closing, email notifications are sent to all users involved in the ticket to keep everyone updated on exactly what is going on.
This module is completely free to all our customers who use the full version of Smartlog. and is immediately available for Company Admins to use.
To book a demo of ‘Help Desk’ for your organisation or to request more information about Smartlog, visit our contact page or send us your query to info@safesmart.co.uk
Safesmart is pleased to announce two-time European Challenge Cup champions Gloucester Rugby as a Smartlog® client.
Competing in the Gallagher Premiership and four-time runners-up of the top division, Gloucester are also five-time Anglo-Welsh cup winners, and will be utilising the cloud-based health and safety software Smartlog to manage risk, compliance, training and safety processes among both personnel and premises.
Safesmart’s Managing Director Sam Secker said:
“We are extremely pleased to have an organisation of Gloucester Rugby’s stature onboard as a client, integrating Smartlog into their health and safety processes as well as tapping into our knowledge and expertise in this field.
We are positive this will be a great relationship going forward for the both of us.”
Gloucester Rugby kick off their 2023-24 season with a Premiership Rugby Cup match against Nottingham on 9 September at 3pm.
A total of 135 workers were killed at work in Great Britain in 2022/23, which is an increase of 12 deaths (9%) from the previous year, newly released Health and Safety Executive (HSE) figures show.
Although this is a significant increase compared to last year, this year’s figure is only slightly above the previous 5-year average of 134 deaths between 2017 and 2022. Overall however, this represents a downward trend in workplace fatalities, with 150 workplace deaths 10 years ago in 2012/13 and a significantly higher 227 deaths in 2002/03.
In this year’s figures, the most common cause of fatal injuries continues to be falls from height (40), followed by being struck by a moving object (29) and being struck by a moving vehicle (20), which all together make up two-thirds (66%) of the figures.
Construction is the most dangerous industry
The construction industry continues to account for the greatest number of workers killed in fatal accidents, with 45 deaths (33%). This is some way higher than the second highest industry, agriculture, forestry and fishing (21 fatalities).
In fact, 82% of fatal injuries occurred in only five industry sectors:
construction,
agriculture, forestry and fishing,
manufacturing,
transportation and storage
wholesale, retail, motor vehicle repair
Older workers are at higher risk
There continues to be a disproportionate risk to older workers, with around 25% (33) of fatal injuries involving workers aged 60+, even though they only make up around 11% of the workforce.
Self-employed workers are at higher risk
Similar to last year, a third (33%) of fatal injuries were to self-employed workers even though they only make up 13% of workers. This is also in line with the 5-year average of 33% of fatal injuries to self-employed workers between 2018/19 and 2022/23.
A positive finding
A more positive finding saw a 23% decrease in workplace fatal injuries to members of the public as a result of a work-related incident, from 88 fatalities in 2021/22 to 68 in 2022/23.
This is also significantly below the previous 5-year-average of 93 from 2017/18 – 2021/22.
The HSE have released the annual health and safety figures for the year 2021/2022, and here are the 5 key takeaways.
1. Stress, depression or anxiety cases are at an all-time high
After work-related stress, depression or anxiety cases reached an all-time high of 824,000 in 2019/20, the number was slightly lower the following year. However, with 914,000 workers suffering from stress, depression or anxiety, this year’s numbers are 11% (91,000 cases) higher than last year’s – which is a record figure.
This means that cases have more than doubled from 442,000 in 2014/15, which is an increase of 107% in only seven years, which puts this worrying trend in perspective. This also correlates with a case rate increase from 1.4% workers to 2.8% in the same 7-year period.
What is the cause for this steep rise in cases? According to the HSE: “the effects of the coronavirus pandemic were found to be a major contributory factor to work-related stress, depression or anxiety”. This remains to be explored further if the trend continues in future statistics.
2. Illnesses and workplace injuries have gone up from last year
Total illnesses have increased by 130,000 cases (8%) from last year, which is the fourth consecutive year the number has increased; whilst workplace injuries have had an even larger jump from last year, increasing by 124,000 cases (28%).
As a noteworthy point: workplace injuries hit their lowest number ever last year (441,000) after an unexpected spike in 2019/20 of 691,000 incidents – the highest number since 2010; however, this year the figure has returned to trendline levels (565,000).
3. Workplace deaths continue to fall
After a spike in workplace fatal injuries last year (145), this year’s figure (123) is the second-lowest on record; and promisingly, the two lowest years on record for workplace fatalities have both occurred in the last three years.
This also means that the 5-year average of 134 deaths is the lowest 5-year average since RIDDOR began collecting records, which is yet more promising evidence of workplace deaths continuing to trend downwards.
Looking closer at the figures, the most common cause of fatal injuries continues to be falls from height (29), followed by being struck by a moving vehicle (23) and then being struck by a moving/flying/falling object (18), which altogether make up more than half (57%) of the fatalities.
The rest of these figures are broken down in more detail here: https://safesmart.co.uk/hse-releases-workplace-fatality-figures-for-2021-22/
4. Human health/social work has the highest illness rate among all industries
According to the Labour Force Survey (LFS), the average work-related illness rate per 100,000 workers for all industries is 4,190 (4.2%), and in contrast, human health/social work has a rate of 6.8%, which is the highest among all industries. This rate has actually lowered from 2020/21’s rate of 7.3% which resulted in 24% of all worker illnesses coming from the human health/social work sector alone.
This provides a clearer picture of how much the coronavirus pandemic affected the health of frontline healthcare workers during its peak.
5. Infectious disease rates are slightly down from last year
Prior to the coronavirus pandemic, overall workplace injuries were trending downwards; and they have now returned to a rate below pre-coronavirus levels. However, in contrast, the rate of illness caused or made worse by work is significantly above pre-coronavirus levels – 4.2% compared to 3.2% in both 17/18 and 18/19.
When looking closer at these figures, the rates of infectious disease (virus, bacteria) have almost tripled – 82,000 workers were affected in 2021/22 compared to 30,000 in 18/19. However, this latest figure is still lower than the 93,000 cases in 20/21, which was at the height of the coronavirus pandemic.
When compiled alongside the massive rise in stress, depression or anxiety cases, this year’s illness figures are the highest on record for both prevalence (1,8 million) and rate per workers (5.4%). With the rate and prevalence of illness also both increasing for the fourth year in a row, this is a growing area of concern and worry in occupational health & safety.
A total of 123 workers were killed in work-related accidents in Great Britain in 2021/22, which is a 15% decrease from the previous year, newly released Health and Safety Executive (HSE) figures show.
According to the latest RIDDOR figures, workplace fatalities have continued their pre-pandemic downward trend, with the latest figures well below the 2016 – 2021 five year average of 136 fatalities.
The drop in fatalities is especially promising, due to the data covering the period April 2021 to March 2022, during which time most COVID-19 restrictions were removed and the economy began returning to normal.
The most common cause of fatal injuries continues to be falls from height (29), being struck by a moving vehicle (23) and being struck by a moving object (18), which all account for over half of the fatalities.
When breaking down according to sector, around a quarter (30) of fatalities occurred in the construction industry, 22 fatalities in the manufacturing sector, and 22 in the agriculture, forestry and fishing sector – which is similar distribution to previous years.
There remains a disproportionate risk to older workers; with around a quarter (29) of fatal injuries involving workers aged 60+, although they only make up around 11% of the workforce. Furthermore, when analysing the data further, the rate of fatalities for workers aged 65+ is around 4 times that of the average rate across all age groups.
Also, there was a 27% increase in workplace fatal injuries to members of the public as a result of a work-related incident, with 80 fatalities in 2021/22 down from 63 last year.
Safesmart will be exhibiting at the ISBL National Conference on Thursday 11 and Friday 12 November 2021 at the Hilton Birmingham Metropole, and we will be situated at Stand 16.
Titled ‘SBPs: The architects of solutions – resourcefully leading change‘, this year’s conference will focus on what school business professionals need to consider to guarantee the most effective use of their resources, including personnel, to deliver the greatest opportunities for pupil progress and development.
Date
Thursday 11 and Friday 12 November 2021
Venue
The Hilton Metropole NEC Pendigo Way Marston Green Birmingham B40 1PP
This site uses cookies. By continuing to use our website you show that you consent to our website’s use of cookies. Click here to view our Privacy Notice.
This website uses cookies to improve your experience while you navigate through the website. Out of these, the cookies that are categorized as necessary are stored on your browser as they are essential for the working of basic functionalities of the website. We also use third-party cookies that help us analyze and understand how you use this website. These cookies will be stored in your browser only with your consent. You also have the option to opt-out of these cookies. But opting out of some of these cookies may affect your browsing experience.
Necessary cookies are absolutely essential for the website to function properly. These cookies ensure basic functionalities and security features of the website, anonymously.
Cookie
Duration
Description
cookielawinfo-checkbox-analytics
11 months
This cookie is set by GDPR Cookie Consent plugin. The cookie is used to store the user consent for the cookies in the category "Analytics".
cookielawinfo-checkbox-functional
11 months
The cookie is set by GDPR cookie consent to record the user consent for the cookies in the category "Functional".
cookielawinfo-checkbox-necessary
11 months
This cookie is set by GDPR Cookie Consent plugin. The cookies is used to store the user consent for the cookies in the category "Necessary".
cookielawinfo-checkbox-others
11 months
This cookie is set by GDPR Cookie Consent plugin. The cookie is used to store the user consent for the cookies in the category "Other.
cookielawinfo-checkbox-performance
11 months
This cookie is set by GDPR Cookie Consent plugin. The cookie is used to store the user consent for the cookies in the category "Performance".
viewed_cookie_policy
11 months
The cookie is set by the GDPR Cookie Consent plugin and is used to store whether or not user has consented to the use of cookies. It does not store any personal data.
Functional cookies help to perform certain functionalities like sharing the content of the website on social media platforms, collect feedbacks, and other third-party features.
Performance cookies are used to understand and analyze the key performance indexes of the website which helps in delivering a better user experience for the visitors.
Analytical cookies are used to understand how visitors interact with the website. These cookies help provide information on metrics the number of visitors, bounce rate, traffic source, etc.
Advertisement cookies are used to provide visitors with relevant ads and marketing campaigns. These cookies track visitors across websites and collect information to provide customized ads.